Whither the Bellwether?
| Categories: academic, statsScientists have calculated that the chances of something so patently absurd actually existing are millions to one. But magicians have calculated that million-to-one chances crop up nine times out of ten.
— Terry Pratchett, Mort
# TL;DR
If Vigo County, IN is a bellwether for US Presidential elections, then so is Valencia County, NM.
And York County, ME; Racine County, WI; and Strafford County, NH.
Besides which, we shouldn’t expect any of them to continue getting it right.
# Background
On the Media’s recent segment “Magic” Terre Haute reports on the search for “one small town that thinks exactly the way the nation does” and as such can predict the results of U.S. Presidential elections. According to Don Campbell amongst others, the current contender is Vigo County, IN which has “voted for the winning candidate in every presidential election except two — 30 out of 32 elections”, and has not “missed in 60 years”. According to Campbell, “No other place in America comes close.”
This immediately raised two questions for me: is Vigo the only candidate for the nation’s bellwether? And are there really even bellwethers in the first place?
To answer them, I collected county-level voting data from ICPSR and the Congressional Quarterly Voting and Elections Collection, covering the period 1840–2012 (code on GitHub, please replicate and extend).
Which are the bellwethers?
First off, it’s true that Vigo hasn’t missed since 1952, but the same goes for Valencia County, NM. They are far from outliers: fourteen other counties have only missed one of those fifteen elections. And I would say it’s even tipping the scales in Vigo’s favour to use it’s winning streak as the basis of comparison to other counties.
| State | Area | prop. correct | #correct | #elections |
|---|---|---|---|---|
| Indiana | Vigo | 1.0000000 | 15 | 15 |
| New Mexico | Valencia | 1.0000000 | 15 | 15 |
| California | Ventura | 0.9333333 | 14 | 15 |
| Delaware | Kent | 0.9333333 | 14 | 15 |
| Florida | Hillsborough | 0.9333333 | 14 | 15 |
| Montana | Blaine | 0.9333333 | 14 | 15 |
| New Mexico | Hidalgo | 0.9333333 | 14 | 15 |
| New Mexico | Sandoval | 0.9333333 | 14 | 15 |
| North Carolina | Buncombe | 0.9333333 | 14 | 15 |
| North Dakota | Sargent | 0.9333333 | 14 | 15 |
| Ohio | Ottawa | 0.9333333 | 14 | 15 |
| Texas | Bexar | 0.9333333 | 14 | 15 |
| Texas | Val Verde | 0.9333333 | 14 | 15 |
| Virginia | Westmoreland | 0.9333333 | 14 | 15 |
| Wisconsin | Juneau | 0.9333333 | 14 | 15 |
| Wisconsin | Sawyer | 0.9333333 | 14 | 15 |
| California | Merced | 0.8666667 | 13 | 15 |
| California | San Bernardino | 0.8666667 | 13 | 15 |
| California | San Joaquin | 0.8666667 | 13 | 15 |
| California | Stanislaus | 0.8666667 | 13 | 15 |
If we instead take into account elections since 1888 then Vigo and Ventura County, CA are tied with 29/32 elections each. These figures are not the same as the ones Campbell quotes, and I’m not quite sure why. It seems like the ICPSR data don’t agree with Dave Leip’s US Election Atlas about Vigo County’s results for 1908, 1892 and 1896. If the ICPSR data are wrong,, that could be enough to make Vigo the single most successful predictor over this time period, but it still wouldn’t be the uncontested winner.1
| State | Area | prop. correct | #correct | #elections |
|---|---|---|---|---|
| Indiana | Vigo | 0.90625 | 29 | 32 |
| California | Ventura | 0.90625 | 29 | 32 |
| Wisconsin | Racine | 0.87500 | 28 | 32 |
| New Hampshire | Coos | 0.84375 | 27 | 32 |
| Iowa | Jasper | 0.84375 | 27 | 32 |
| Iowa | Palo Alto | 0.84375 | 27 | 32 |
| Nebraska | Douglas | 0.84375 | 27 | 32 |
| Oregon | Clackamas | 0.84375 | 27 | 32 |
| Connecticut | Windham | 0.81250 | 26 | 32 |
| Maine | York | 0.81250 | 26 | 32 |
| New Hampshire | Strafford | 0.81250 | 26 | 32 |
| Delaware | New Castle | 0.81250 | 26 | 32 |
| New Jersey | Middlesex | 0.81250 | 26 | 32 |
| Indiana | Delaware | 0.81250 | 26 | 32 |
| Indiana | Madison | 0.81250 | 26 | 32 |
| Indiana | St Joseph | 0.81250 | 26 | 32 |
| Indiana | Vanderburgh | 0.81250 | 26 | 32 |
| Ohio | Montgomery | 0.81250 | 26 | 32 |
| Ohio | Portage | 0.81250 | 26 | 32 |
| Iowa | Bremer | 0.81250 | 26 | 32 |
For some reason, most reports about Vigo County’s bellwether status start from 1888. I’m not an expert on US political geography, but it’s not clear to me why they choose that date. There might be something significant about 1888 in terms of the structure of the electoral system, or the geography of states and counties, but I haven’t found it so far. So I saw no reason to not look back even further.2
On elections since 1840, Vigo County still does pretty well, but there are nine other counties either tied with or ahead of it. Depending on how the missing data fall, these counties could be pushing 84% agreement with the election result. Racine County, WI might be the single best bellwether given that it predicts 34 out of the 40 elections for which there is data. If it called all the missing elections right, it would have 86%. Even given the missing data, Racine gets as many right as York and Strafford. Still, over this time period only a few counties have above 80% correct predictions.
| State | Area | prop. correct | #correct | #elections |
|---|---|---|---|---|
| Maine | York | 0.8292683 | 34 | 41 |
| New Hampshire | Strafford | 0.8292683 | 34 | 41 |
| New Hampshire | Hillsborough | 0.8048780 | 33 | 41 |
| Ohio | Portage | 0.8048780 | 33 | 41 |
| Connecticut | Windham | 0.7804878 | 32 | 41 |
| Illinois | Macon | 0.7804878 | 32 | 41 |
| Illinois | Will | 0.7804878 | 32 | 41 |
| Indiana | St Joseph | 0.7804878 | 32 | 41 |
| Indiana | Vigo | 0.7804878 | 32 | 41 |
| Ohio | Stark | 0.7804878 | 32 | 41 |
| Maine | Washington | 0.7560976 | 31 | 41 |
| New Hampshire | Coos | 0.7560976 | 31 | 41 |
| New Hampshire | Sullivan | 0.7560976 | 31 | 41 |
| New Jersey | Atlantic | 0.7560976 | 31 | 41 |
| Indiana | Delaware | 0.7560976 | 31 | 41 |
| Indiana | Vanderburgh | 0.7560976 | 31 | 41 |
| Michigan | Macomb | 0.7560976 | 31 | 41 |
| Michigan | Shiawassee | 0.7560976 | 31 | 41 |
| Michigan | Van Buren | 0.7560976 | 31 | 41 |
| Ohio | Columbiana | 0.7560976 | 31 | 41 |
Finally, spare a thought for Webster County in Georgia. Since its founding in 1853 it has only voted in line with the national trend in 13 out of the 37 elections for which there are data. That makes it a somewhat reliable an anti-bellwether: if you looked at the result from Webster and picked the opposite, you’d do better than 75% of other counties with as much data.3
# Are there actually bellwethers?
A quick Google Scholar search reveals surprisingly few academic papers about in Presidential election bellwethers. Perhaps the best is this 1975 paper by Tufte (yes, that Tufte) and Sun. It concludes that there are no bellwether counties because bellwether status can only reliably be assigned after the fact.
This is a common problem which you come across in both machine learning and the social sciences. Once you’ve observed an outcome it’s trivial to tweak your prediction to predict the thing that’s already happened. And once you’ve made a prediction of the past, you can come up with a justification that not only makes it look like it’s the only possible prediction that could have been made, but also convinces you that you could have made it before the fact.
We can do something like Tufte’s analysis using our larger data set. For simplicity’s sake, let’s look at the accuracy of counties that have had, at any point in time, the same 60-year, 15-election streak that Vigo currently enjoys (Tufte and Sun look at streaks from 24 to 48 years).
Take 1968, for example. Northampton, PA and Prince George’s, MD (as well as four other counties) had predicted the correct result in all the elections since 1908 — the same correct streak that Vigo has now. But in 1968 Northampton voted for McGovern and Prince George’s voted, correctly, for Nixon. All in all, there are 90 cases in which a county had a streak of 15 correct predictions behind it going into an election year (for 43 distinct counties). But in 47% of those cases, the county failed to get the next election right. Pretty close to a coin-toss.
This graph (click on it for a bigger image) shows the performance over time of the 20 counties that have, at one time or another, had a streak longer than Vigo’s current one.
<a href=/streaks.png>
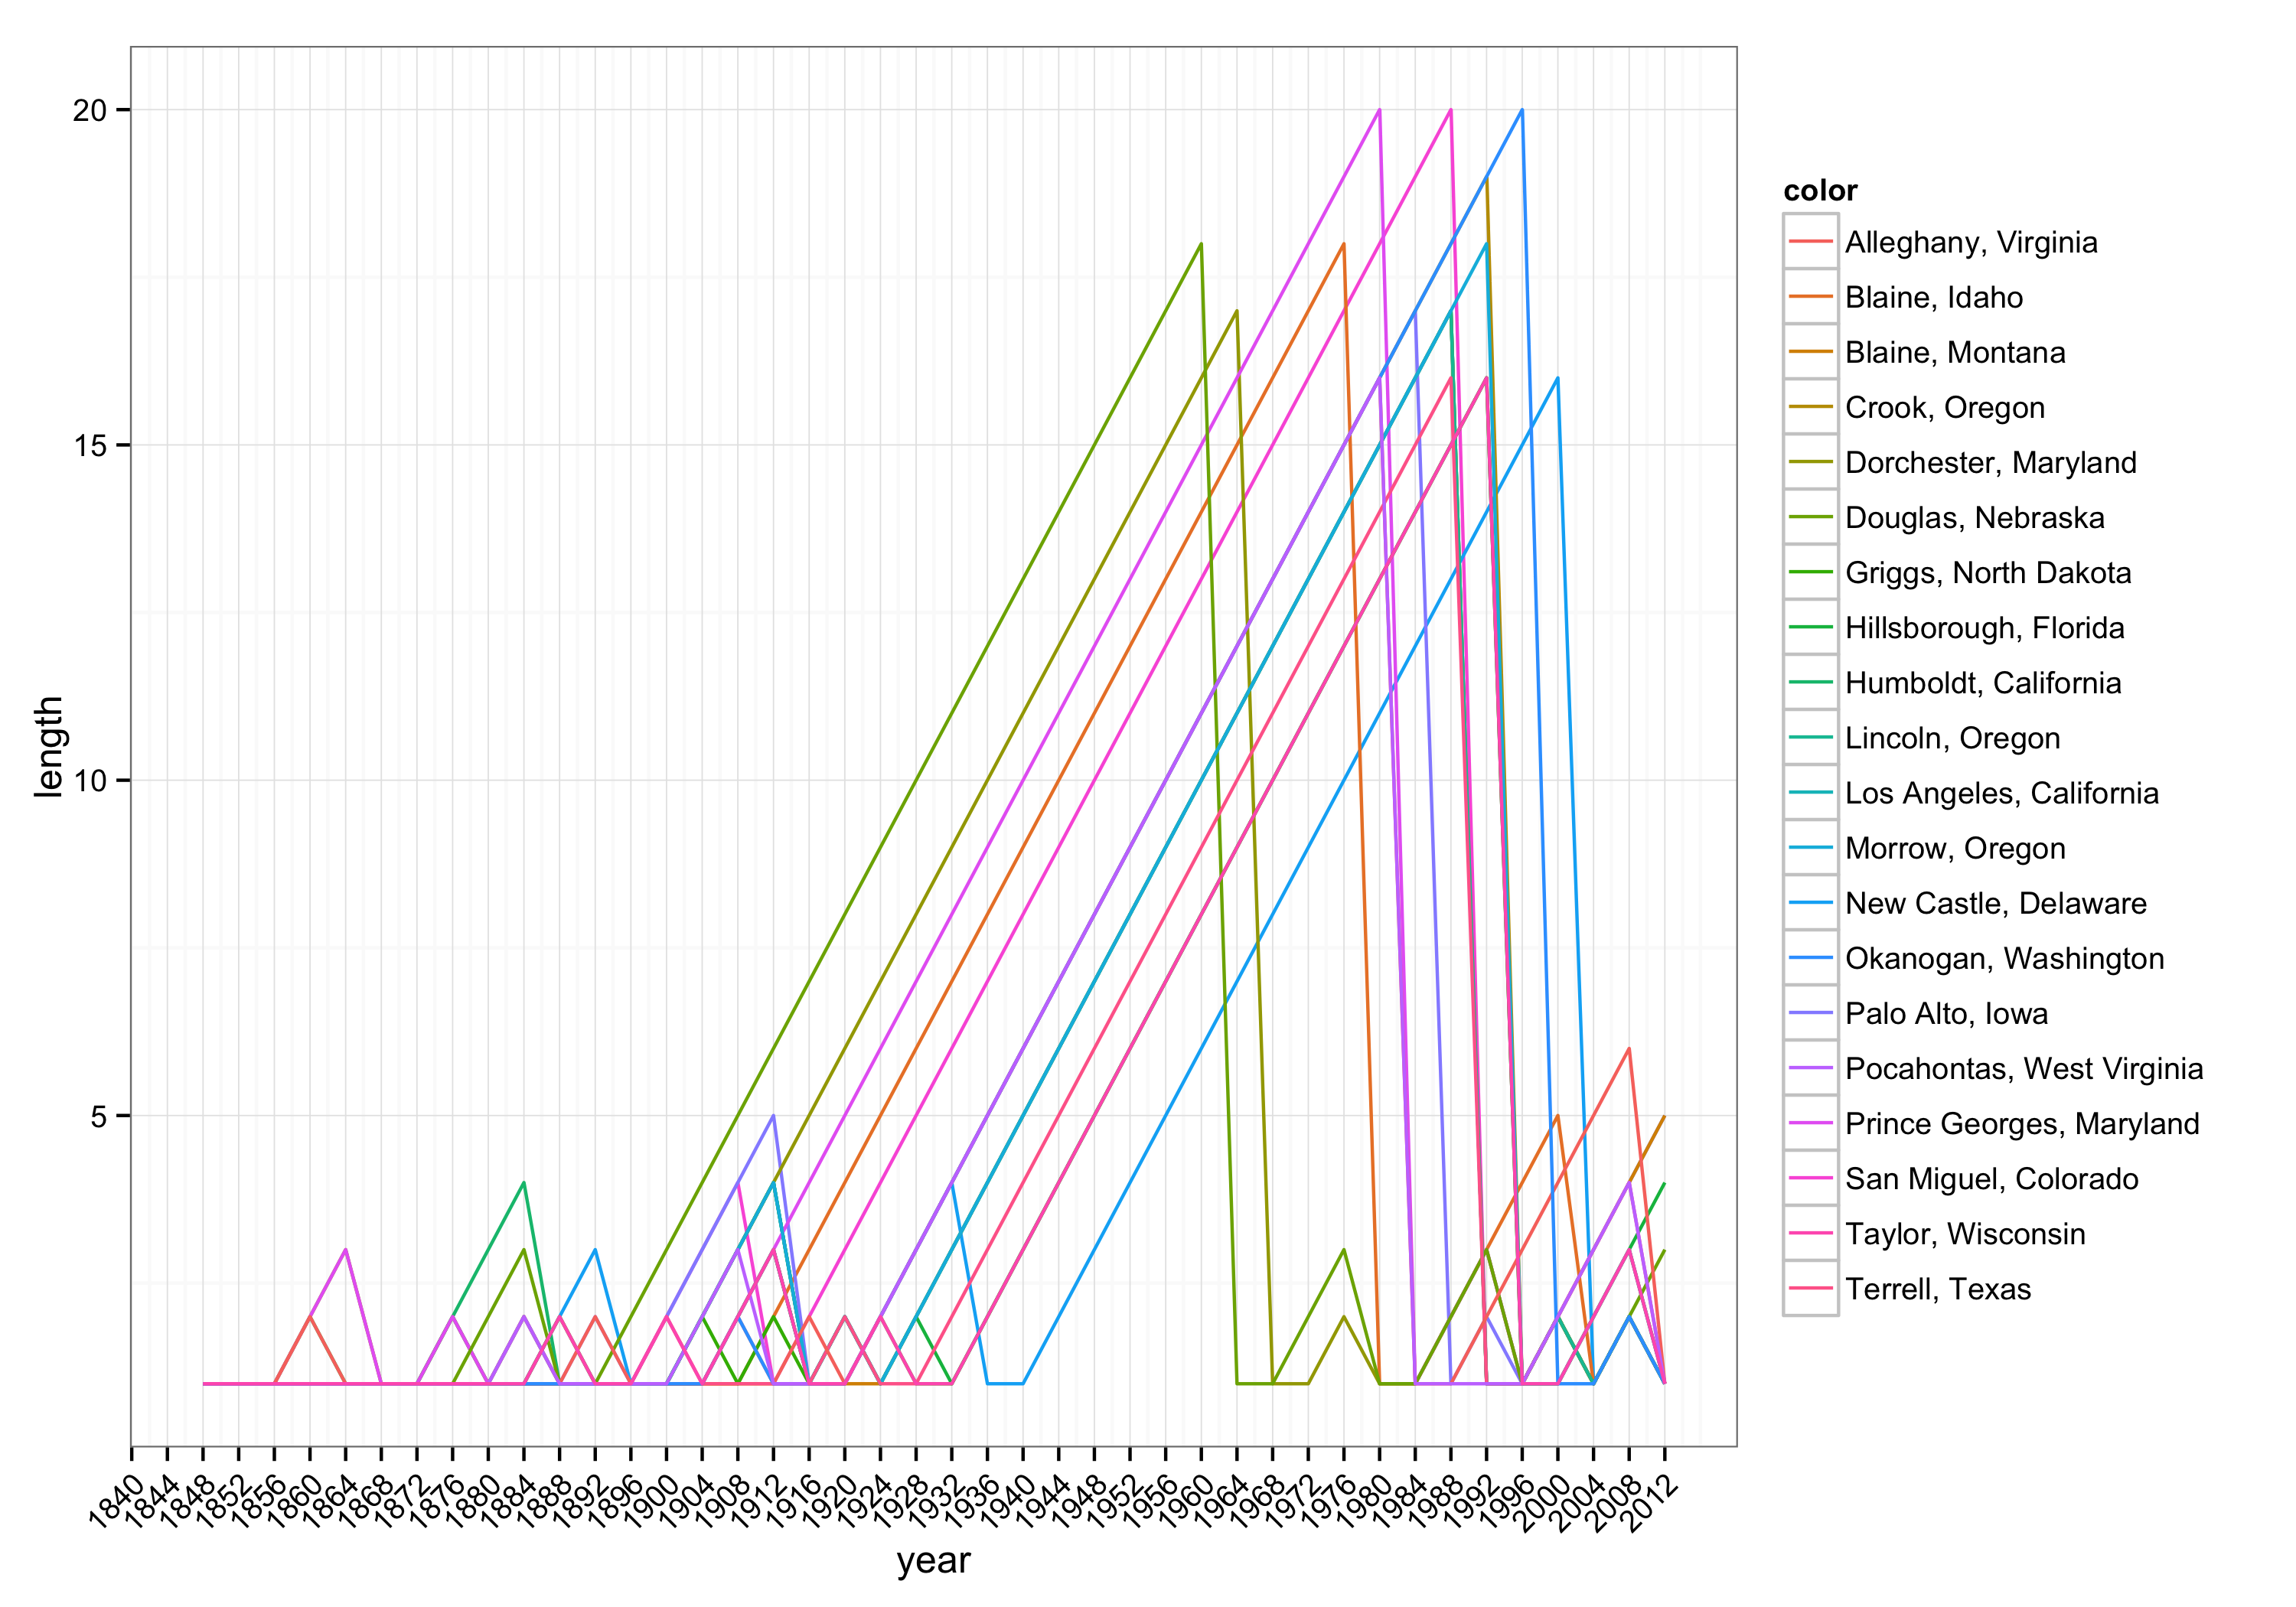 </a>
</a>
The fatalism in this plot is almost the opposite of the problem of post-hoc prediction: the counties with the longest streaks necessarily fall of a cliff shortly after.
# What is a bellwether anyway?
So far, we’ve worked out that Vigo isn’t the only bellwether, and bellwethers aren’t particularly great at making predictions. But what is it exactly that we’re asking them to do?
The most common version of the bellwether is what Tufte and Sun call the “all-or-nothing” barometric bellwether: a county in which the majority vote is for the person who’s eventually elected President. That’s what we’ve been looking at so far and as such, we’re interested in the classificatory accuracy of the county: what proportion of elections it gets right. But you might also look for counties where the percentage for each candidate is closest to that from the popular vote. That’s not the same thing: given that many contests are close to 50/50, calling the right outcome can sometimes be a matter of a few tenths of a percent, so measuring the difference in vote percentages directly might be a more fair measure of a bellwether.
That said (and not having looked at the data) I don’t think it will make a difference to the results above. Dave Leip’s US Election atlas reports that Vigo county has had a mean absolute difference from the national result of 0.9pp. That might give it the edge in accuracy of prediction of the vote percentages, but I doubt switching to that measure will make it the singularly best predictor.
Also, what we’re asking bellwethers to do is strange given the institutional structure of US Presidential elections, namely that the winner of the popular vote is not necessarily the winner of the election. So to predict all elections correctly, a bellwether would sometimes have to go against the popular vote. In 2000, for example, a majority of voters in Vigo County voted for George Bush — but the winner of the nationwide popular vote was Al Gore. Vigo somehow got the election right while getting the popular vote wrong. Bellwethers are supposed to work because they’re a microcosm of the US, their demographics and opinions being proportional to those of the nation as a whole. How do we explain the cases then where in order to predict the outcome, the bellwether’s voters had to predict not the nation’s popular vote, but the distinctly non-proportional outcome of the electoral college — presumably taking into account such factors as Maine and Nebraska’s Congressional district method, faithless electors and the Huntington-Hill method?
As I said, it’s also often claimed that these bellwethers are accurate because their populations are representative of demographic and attitudinal characteristics on a national level. The OtM piece notes that Vigo county is not particularly demographically similar to the nation as whole, so that’s already kind of dubious. As Campbell noted, some of it is certainly luck, but I may have to look further into the makeup of the potential bellwether.
# Conclusion
The search for predictive accuracy is always stymied by the risk of post-hoc prediction. In machine learning, this is dealt with by a strict separation of the data you’re allowed to look at (the training set) from the data you use to evaluate your prediction (the test set). Failing this, it’s easy to over-fit, to produce a model that can perfectly predict what has already happened but cannot generalise to the future.
According to my quick analysis,4 that’s at least part of the story with bellwethers too. Vigo County gets all the press, but there are other equally accurate counties. Even those are not great predictors in the long term.
Of course, it may be that pure predictive power is not why we should be paying attention to bellwethers. We certainly learn something about the American populace by studying a small town in detail, as we did from the Middletown studies. But the conclusions we can make from such places are not generalisable to the whole country in the (relatively) straightforward statistical sense. If we’re going to learn from Vigo, Valencia, York, Racine, and Strafford, we’ll need to make use of well-informed and sensitive interpretation. That’s what a documentarian like Campbell is well-placed to develop. Looking at it another way, bellwethers aren’t an alternative to the punditry so lamented by OtM, they’re fuel for them.
So, are the citizens of Vigo County “history’s most reliable presidential bellwethers”?
Not quite, Bob, not quite.
Citations
- Broh, C. Anthony. “Whether Bellwethers or Weather-Jars Indicate Election Outcomes.” The Western Political Quarterly (1980): 564-570.
- Clubb, Jerome M., William H. Flanigan, and Nancy H. Zingale. Electoral Data for Counties in the United States: Presidential and Congressional Races, 1840-1972. ICPSR08611-v1. Ann Arbor, MI: Inter-university Consortium for Political and Social Research [distributor], 2006-11-13. http://doi.org/10.3886/ICPSR08611.v1
- CQ Voting and Elections Collection
- Kenski, Henry C., and Edward C. Dreyer. “In Search of State Presidential Bellwethers.” Social Science Quarterly 58.3 (1977): 498-505. http://www.jstor.org/stable/42859841
- Lewis-Beck, Michael S. “Election forecasts in 1984: how accurate were they?.” PS: Political Science & Politics 18.01 (1985): 53-62.
- Paleologos, David, and Elizabeth J. Wilson. “Use of Bellwether Samples to Enhance Pre-Election Poll Predictions: Science and Art.” American Behavioral Scientist 55.4 (2011): 390-418.
- Robertson, David Brian. “Bellwether politics in Missouri.” The Forum. Vol. 2. No. 3. 2004.
- Tufte, Edward R., and Richard A. Sun. “Are There Bellwether Electoral Districts?”. The Public Opinion Quarterly 39.1 (1975): 1–18. http://www.jstor.org/stable/2748067
-
It’s also possible that there’s some weirdness happening with county names changing, or counties and independent cities in the same state having the same name. I caught some of these, but only when they obviously affected the result. ↩
-
I did choose these dates purely because the data were easiest to access. It should be possible extend the analysis using data from 1788 onwards, although they seem to become more incomplete the further back you go. ↩
-
This missing data problem is more of an issue here than I’m used to: when there are only 57 events, missing one or two of them can make a big difference. ↩
-
By all means, please check my math, especially if you know what’s going on with some of the weird discrepancies and missing data. ↩